DreaMS-Fluorine
1. Obtain model weights
Please contact us at roman.bushuiev@uochb.cas.cz to request the DreaMS-Fluorine model weight files (dreams_fluorine_epoch=1-step=7000.ckpt and dreams_fluorine_epoch=30-step=111000.ckpt). After receiving them, place both files in /DreaMS/dreams/models/pretrained/.
Note that DreaMS-Fluorine was trained using NIST20, so we can share the weights only with NIST library license holders. Please attach your NIST license or order confirmation to the email.
2. Run DreaMS-Fluorine
Execute the following command, where --in_dir specifies the folder containing .mzML or .mgf files (here, data/MSV000099559). The script will generate dreams_fluorine_predictions.csv in the same folder, containing predicted fluorine-presence probabilities for each MS/MS spectrum in each file. The current model version supports positive-mode data only.
python3 dreams/cli.py dreams_fluorine --in_dir data/MSV000099559
3. Examine the predictions
[2]:
import pandas as pd
df = pd.read_csv('../data/MSV000099559/dreams_fluorine_predictions.csv')
df
[2]:
| RT | charge | file_name | polarity | precursor_mz | precursor_target_mz | scan_number | spectrum | window_lo | window_uo | F_preds_111k_steps | F_preds_7k_steps | dformat | tag | |
|---|---|---|---|---|---|---|---|---|---|---|---|---|---|---|
| 0 | 810.063540 | 1 | MO23S_030.mzML | 1 | 304.891639 | 304.891632 | 4153 | [[81.07015991210938, 83.0491714477539, 84.9596... | 0.5 | 0.5 | 0.923519 | 0.210867 | A | Only 111k checkpoint > 0.9 hit |
| 1 | 34.545791 | 1 | MO23S_030.mzML | 1 | 241.999878 | 241.999878 | 133 | [[81.07012939453125, 84.95979309082031, 84.964... | 0.5 | 0.5 | 0.921477 | 0.217751 | A | Only 111k checkpoint > 0.9 hit |
| 2 | 514.087512 | 1 | MO23S_030.mzML | 1 | 204.138540 | 204.138535 | 2640 | [[78.58903503417969, 79.05422973632812, 84.044... | 0.5 | 0.5 | 0.913897 | 0.604710 | A | Only 111k checkpoint > 0.9 hit |
| 3 | 810.776700 | 1 | MO23S_027.mzML | 1 | 328.915390 | 328.915405 | 4179 | [[81.06999206542969, 87.28488159179688, 90.947... | 0.5 | 0.5 | 0.903643 | 0.140945 | A | Only 111k checkpoint > 0.9 hit |
| 4 | 809.980320 | 1 | MO23S_027.mzML | 1 | 304.891539 | 304.891541 | 4175 | [[84.95977783203125, 85.2956314086914, 90.0553... | 0.5 | 0.5 | 0.878663 | 0.227668 | A | Only 111k checkpoint > 0.75 hit |
| ... | ... | ... | ... | ... | ... | ... | ... | ... | ... | ... | ... | ... | ... | ... |
| 11125 | 745.386000 | 2 | MO23S_027.mzML | 1 | 615.455358 | 615.455383 | 3859 | [[79.05448150634766, 80.05440521240234, 81.069... | 0.5 | 0.5 | 0.000000 | 0.000000 | A | NaN |
| 11126 | 745.794840 | 2 | MO23S_027.mzML | 1 | 593.442417 | 593.442444 | 3861 | [[80.05455780029297, 81.06998443603516, 83.085... | 0.5 | 0.5 | 0.000000 | 0.000000 | A | NaN |
| 11127 | 747.321360 | 2 | MO23S_027.mzML | 1 | 571.429528 | 571.429504 | 3868 | [[80.05457305908203, 81.06989288330078, 83.085... | 0.5 | 0.5 | 0.000000 | 0.000000 | A | NaN |
| 11128 | 748.533720 | 2 | MO23S_027.mzML | 1 | 549.416251 | 549.416260 | 3874 | [[80.05448150634766, 81.06990814208984, 81.132... | 0.5 | 0.5 | 0.000000 | 0.000000 | A | NaN |
| 11129 | 749.549340 | 2 | MO23S_027.mzML | 1 | 527.403199 | 527.403198 | 3879 | [[77.15992736816406, 77.27590942382812, 80.054... | 0.5 | 0.5 | 0.000000 | 0.000000 | A | NaN |
11130 rows × 14 columns
The prediction file contains standard metadata parsed from the input files, such as retention time (RT) and precursor m/z (precursor_mz), which can be used to reference the input spectra. In addition, it includes DreaMS-Fluorine predictions in the columns F_preds_111k_steps and F_preds_7k_steps. These columns represent fluorine presence probabilities predicted by two versions of the DreaMS-Fluorine model trained for different numbers of steps.
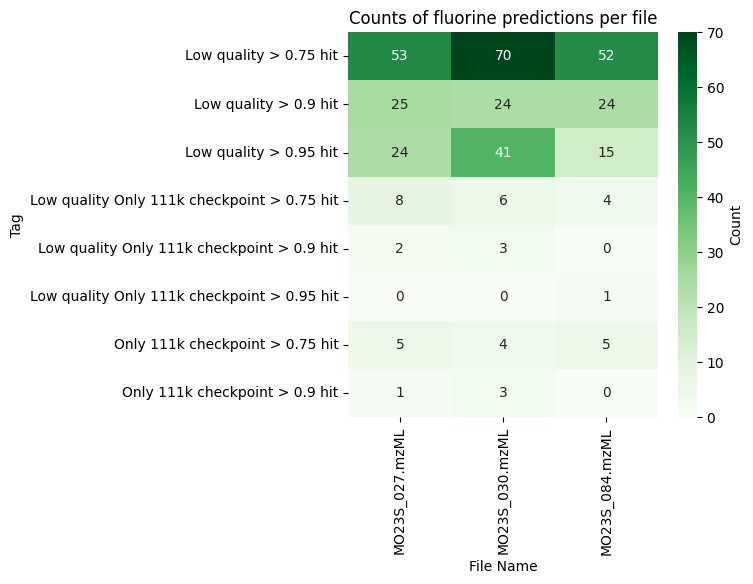
We consider a prediction to be confident if both models predict a fluorine probability of at least 0.75. Such cases are annotated in the tag column as > 0.75 hit, > 0.9 hit, or > 0.95 hit, depending on the prediction scores. Less confident predictions are labeled as Only 111k checkpoint > 0.75 hit, Only 111k checkpoint > 0.9 hit, or Only 111k checkpoint > 0.95 hit, indicating that only the model trained for 111k steps produced a confident prediction.
We further classify spectra into low- and high-quality categories (see Fig. 2b). If a spectrum is of low quality but still yields a confident prediction, the model may be hallucinating the result (for example, for spectra containing only a single signal). Such cases are therefore marked with a Low quality prefix in the tag column. If the tag value is NaN, the spectrum is not predicted to correspond to a fluorinated
molecule.
The plot below summarizes these tags for three files from the example MSV000099559 dataset. While there are no highly confident predictions supported by both models, there are 18 predictions of fluorinated molecules supported by only one of the models (corresponding to the last two rows in the heatmap).
[13]:
import matplotlib.pyplot as plt
import seaborn as sns

df_plot = df[df['tag'] != '']
tag_file_counts = df_plot.pivot_table(index='tag', columns='file_name', values='RT', aggfunc='count', fill_value=0)
plt.figure(figsize=(5, 5))
sns.heatmap(tag_file_counts, annot=True, fmt='d', cmap='Greens', cbar_kws={'label': 'Count'})
plt.xlabel('File Name')
plt.ylabel('Tag')
plt.title('Counts of fluorine predictions per file')
plt.show()